
What are Real Life Infographics? Real Life Inforgraphics or data that is represented by physical objects, is an up and coming trend in the way we share information. In fact, it is so new there isn’t really a word for it yet. We can call them ‘physical infographics’ or ‘real world visualization’ as well. They visualize data with real objects, often combined with typography.
Real Life Infographics are different than other inforgraphics in that they rely much more on photographs instead of a purely digital medium. Moving away from the Everthing-Is-Possible-Unicorn-Utopia of Illustrator is an interesting limitation, as well as a simplifying one. As designers we like to come up with creative ways to display information that will still blow your mind, despite any technical limitations. The real world isn’t perfect, and therefore it may not be as accurate as abstract shapes like graph bars. Even though these visualizations still strive for accuracy, you will notice that the context of these graphics will become much more important than precision. Let’s take a look
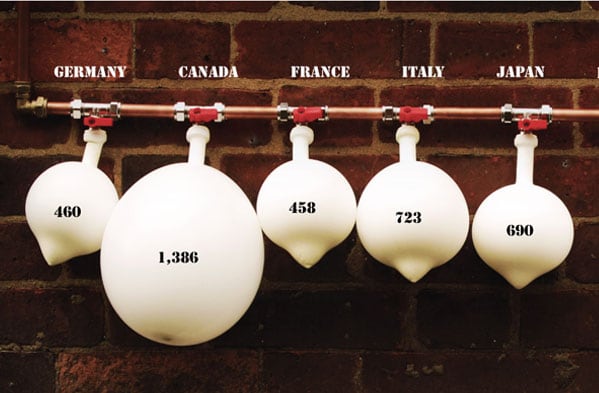
01. Fresh Water Withdrawal

Fresh water withdrawal per capita. The graphic mostly plays on emotions; the suspense of the balloon that is about to hit the nail and explode is forbidding, and warns us we’re not heading in the right direction.
02. Global Pharmacy

The graphic by itself doesn’t tell us much. Photographer Johnny Christmas who created this image says: “Global Pharmacy shows, on average, the amount of pills consumed a year for a male living in the UK. His life expectancy is 77 and he will take as many pills in the last ten years of his life, as he does in the first sixty-six.” Which brings us to the next infographic.
03. Pharmaceutical Drugs Found in Fish

How much of our medicine ends up in fish? Not enough to have an effect on us by consuming fish, but certainly enough to be harmful to marine life. This graphic is a creative way of spreading awareness about this topic. Made by Oliver Uberti, design editor at the National Geographic magazine.
04. Anatomy CV
 Although I think the feeling that this graphic provokes seems a tad too dramatic for it’s topic, it certainly is a very creative way to express a resume. Vu-Tuan-Dang Tran, the designer, wanted his CV (resume) to come from inside of him and decided to write it on his flesh and bones.
05. Zip Flies

Designer Sarah Illenberger created a stunning series of infographics based on the results of a sex survey from a German magazine. The question at the top translated from German says: “How many people have you slept with?” Now the zipper-flies make sense, even though they don’t help to visualize the information as accurately as a graph can. So, it is not the visual precision of the information that makes this graphic striking, but the choice of symbolism that corresponds with the story the graphic is telling us.
06. Water Usage and Fast Food

The figures used in this graphic are actually handmade paper objects. Check it out in detail on Behance.
07. Interest no. 4 Series


This project by Danish designer Peter Ørntoft has won the gold in the ‘Information is Beautiful’ awards. About Interest no. 4Ørntoft says: “Interest no. 4 is refugees and immigrants. The focus of the interest deals with whether or not the Danes think its ethical to wear religious symbols in public professions. I have used the looks and appearances of traditional religious symbols to design the diagrams explaining the data.” Click here to see his other work on the project: Interest no. 5 (Health and health care) and Interest no. 6 (Law and order).
08. Lunar Tides


Daniel Comite first created a poster, visualizing the ocean tides in his hometown corresponding with the moon cycles. After that he created this clever three-dimensional piece making use of cast shadows to reflect the rhythmic tides.
09. 100 Years of World Cuisine

This is perhaps the most disturbing infographic I have ever laid eyes on. Besides the couple of ghostly pieces of kitchenware hanging in mid air, this graphic casually lays out millions of deaths on the table. It is unthinkable that these 38 million deaths aren’t even a quarter of the total death toll in the 20th century. This infographic isn’t exactly functional, it’s difficult to compare the quantities and the proportions are probably not precise. However, the designers weren’t aiming to show something scientific, but rather to provoke certain emotions: “Our understanding of conflicts is often nothing more than a handful of digits, the more precise, the less meaningful. (..) We wanted to put a picture on these digits. A shocking, gory picture, like the reality of war. We wanted to give context, like a scale on which we could visualize each conflict next to the others.”
10. Vegetarianism

This image is aesthetically pleasing and although maybe less striking than 100 Years of World Cuisine, it gets the point across.
11. Color and Space Series


Color and Space shows us the most commonly pinned room colors on Pinterest. The creators only scraped data together from boards in Turkey; after doing further research they concluded that these circle diagrams would look very different per region. Would there be more color preference correlations possible? For example, our profession and let’s say, our top pick for kitchen floors?
12. Facebook Annoyances

Maybe this is not fully a real life infographic, but I certainly think it is most effective as is. I can already hear that painful screeching sound of nails on a black board, and the disturbed annoyed emotion that comes with it. An illustration would have been less effective.
13. Graffiti Series


Instant data on the wall, what a brilliant idea. In my mind, good graffiti aims to communicate issues effectively to people who are passing by. This customizable pie-chart stencil is a very clever way of doing so.Golan Levin thinks data visualization and graffiti is a natural marriage. However: “The greatest potential for infographic street art, it seems to me, has yet to be explored.”
14. Thanksgiving: There is Always Room for Pie

If I had to create this graphic I would be extremely happy to make this real pie-chart, yum!
15. A Manual Dissection of Danish Rye Bread


This graphic closely examines Danish rye bread. What this dense loaf of bread is made out of and how healthy it is. It took 8 hours to dissect; the easier route would be to use the baker’s recipe but it would have looked very different. “Thanks to its wide variety of seeds and grains, rugbrød has much higher protein and fiber content than white bread. The amount of carbohydrates in each slice is about double.”
16. Sugar Stacks Series


How much sugar do you consume from food and drinks? These series will show you the amount of sugar stacked out in sugar cubes per brand. Quite shocking. See all beverage here.
17. Fruit Drink Advertisement


Fun and successful way to brand your drink as containing real fruit.
18. What Parents say and Children do

Speaks for itself, right?
19. Spoon vs Fork

This massive real time graphic made out of thread shows us what human profiles prefer spoons or forks. It’s important to realize that red means spoon and white means fork. So now we know, younger people prefer spoons and retired people definitely prefer forks.
20. Paper Pie Chart

This pie chart is constructed out of all different kinds of paper, it expresses the breakdown of paper production in the US in the year 2000 accordingly. It is quite a surprise to me that packaging is only 5%. I’m curious to see if that percentage is higher now and if we use less plastic and more paper for packaging.
21. Paper Infographic Series


This series covers some interesting topics: blood donors, energy, and death causes. The feeling of these topics are visually echoed successfully and simply. The organic but structural properties of blood echoes back into the visual forms of this piece. The text in the key is difficult to read, but we can see that B- and AB- are the least common blood types and O+ the most common. That means the colors don’t follow each other up logically in a gradient; the lightest red is the least common, but that darkest red is not the most common. Same with the Energy chart. The designer chose that function needs to bow for aesthetics and that shows — it is beautifully designed and executed, but somewhat challenging to understand at first glance. Building this up out of real paper as opposed to computer graphics, creates beautiful texture and great depth, tempting you to touch it. On top of that it’s more suitable to be hung up in a gallery.