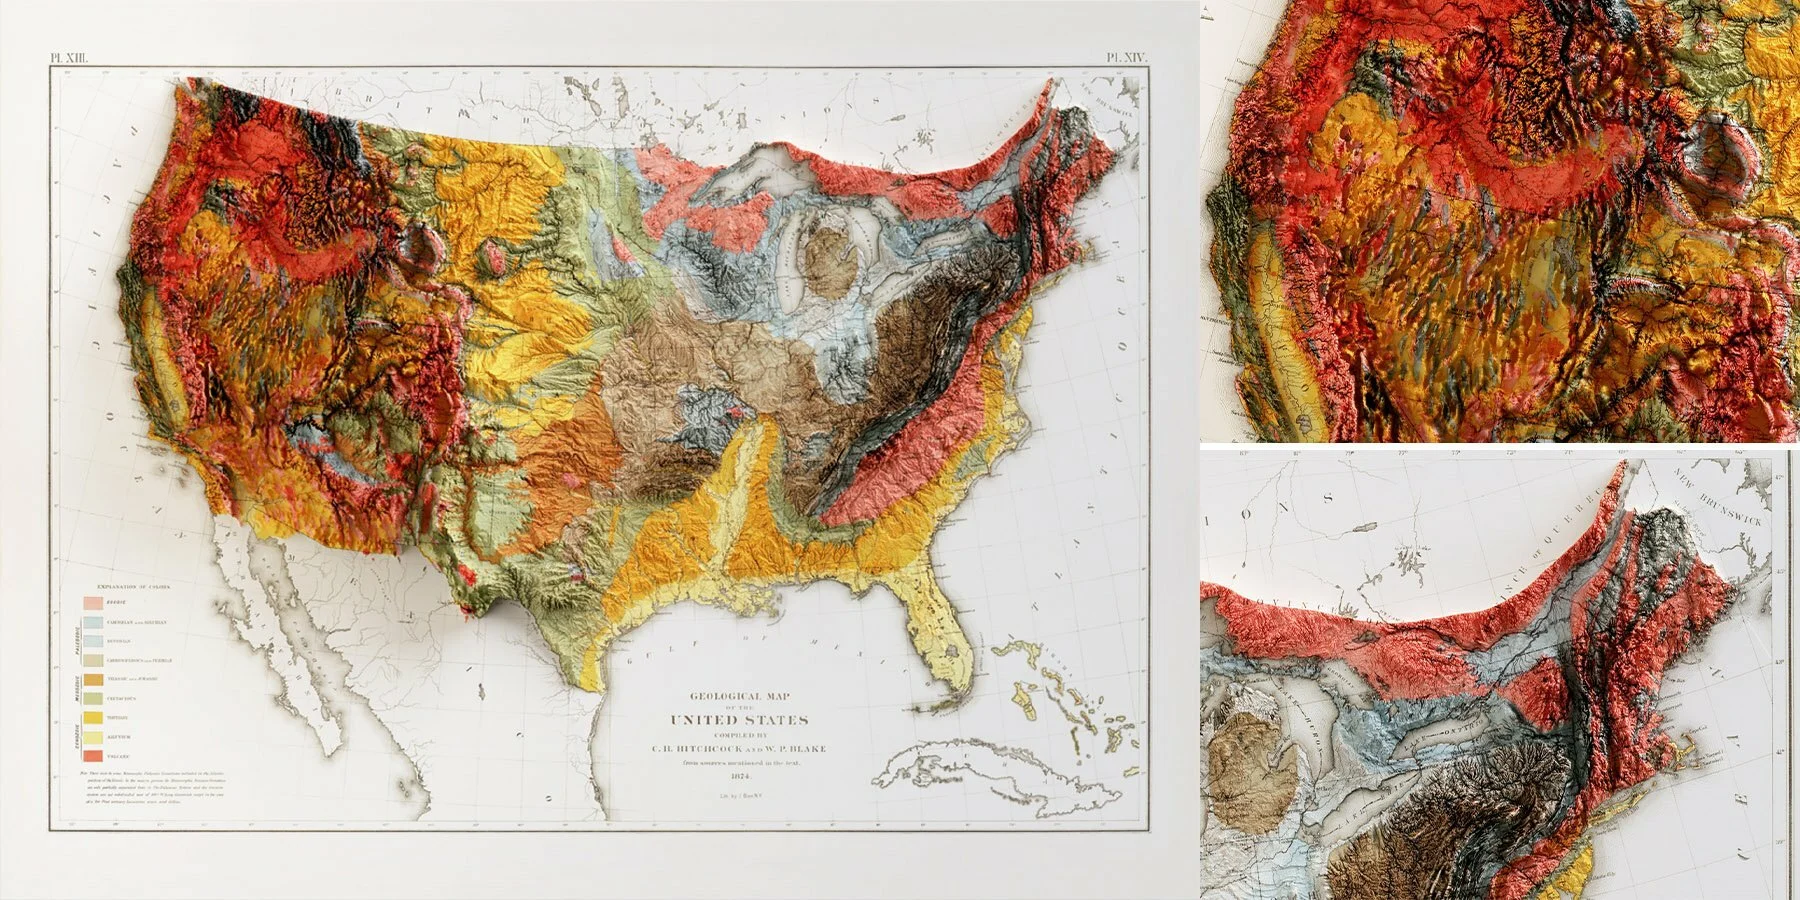
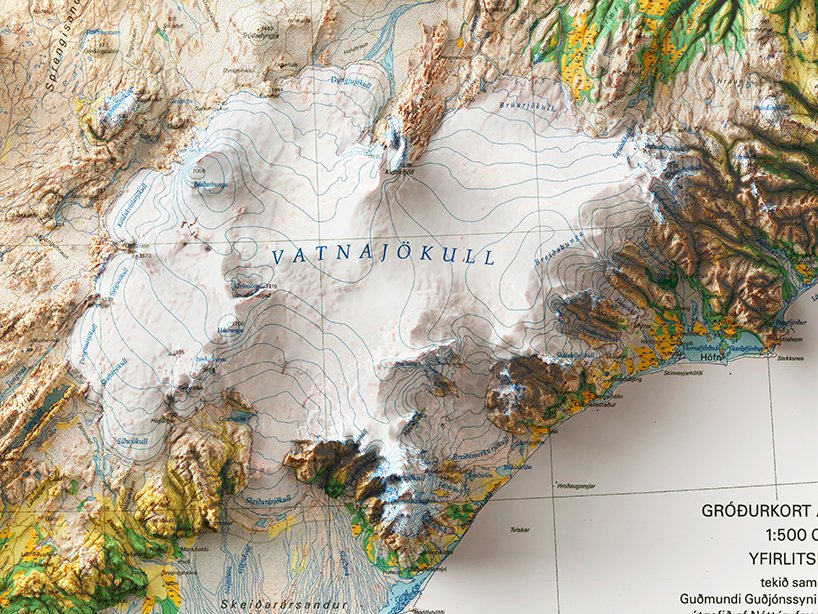
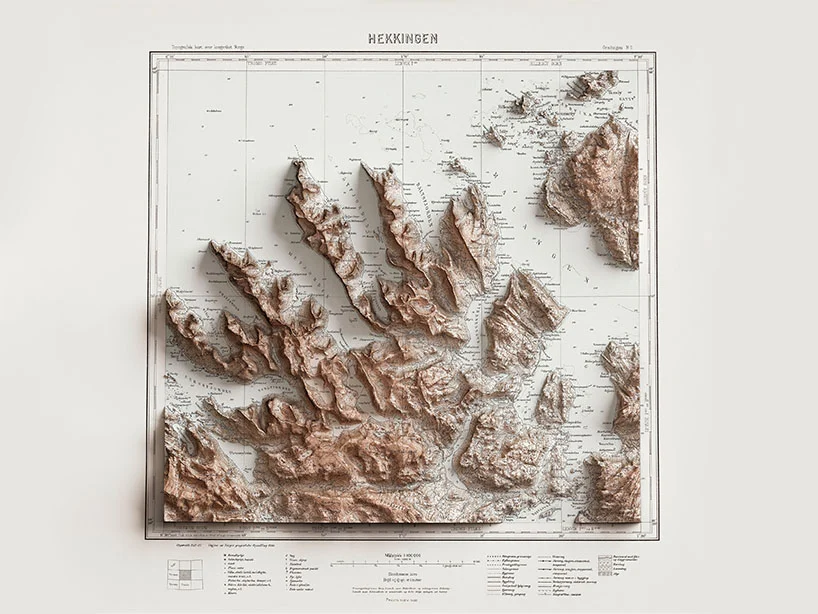
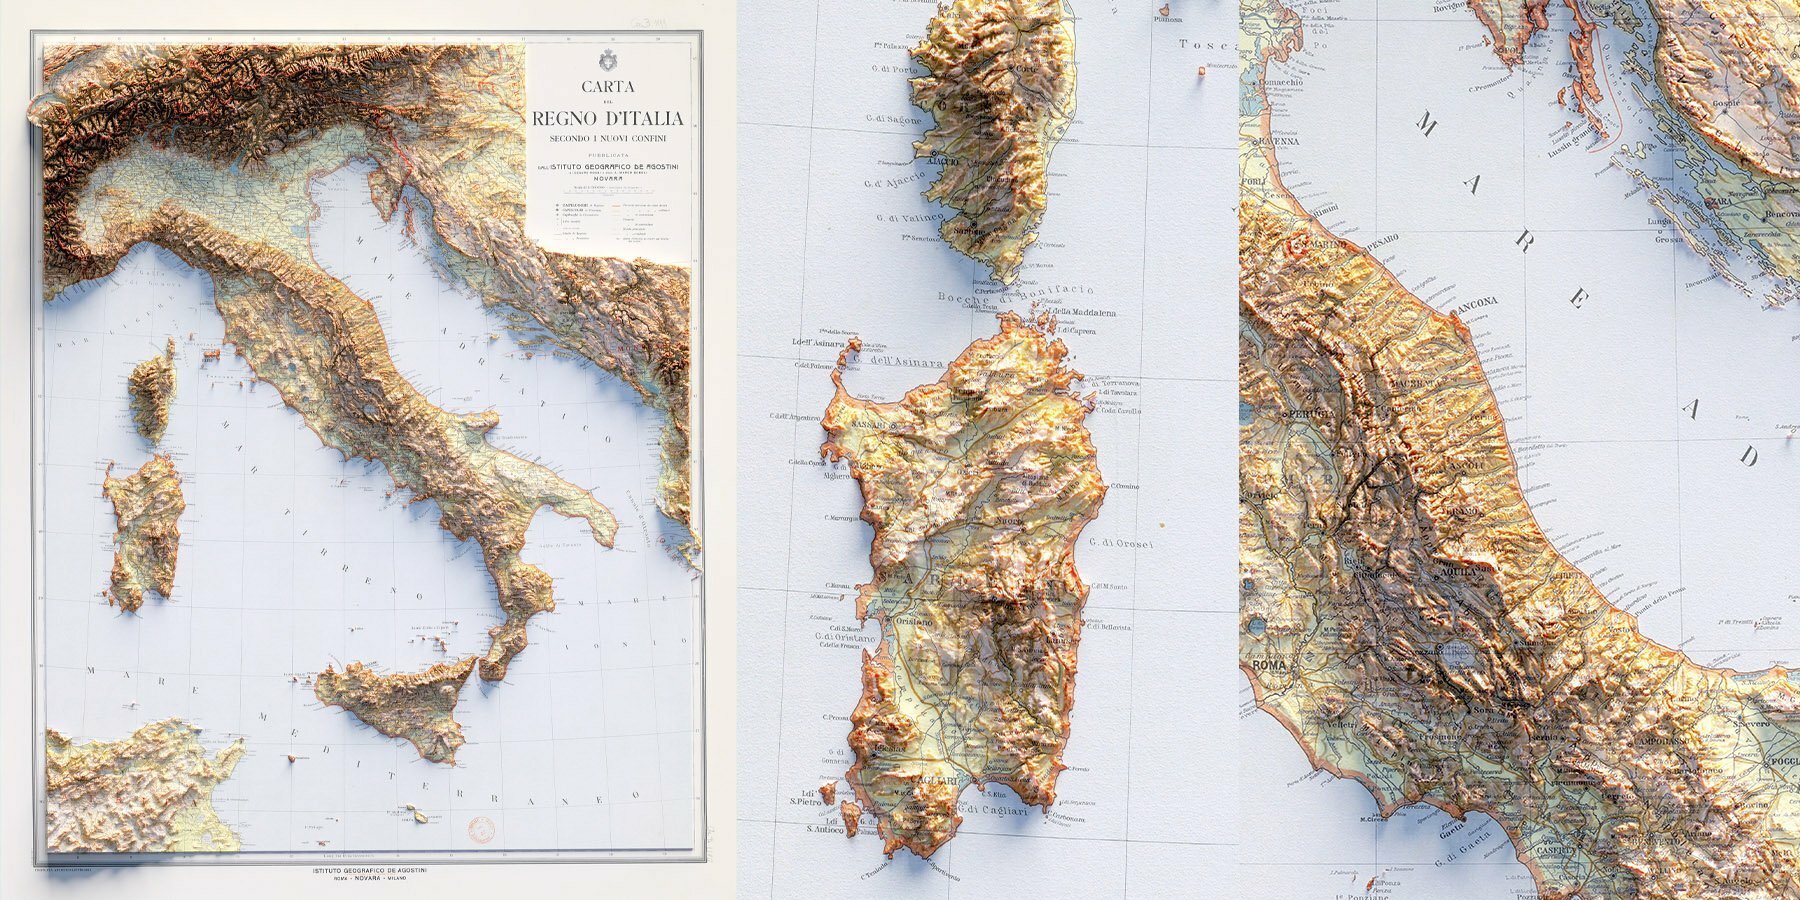
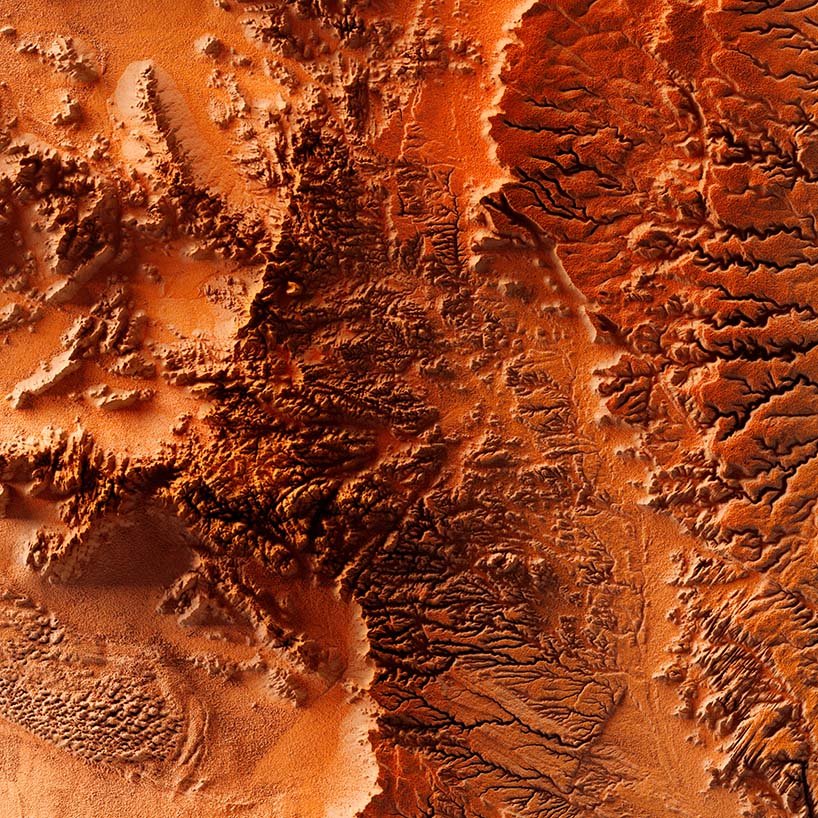
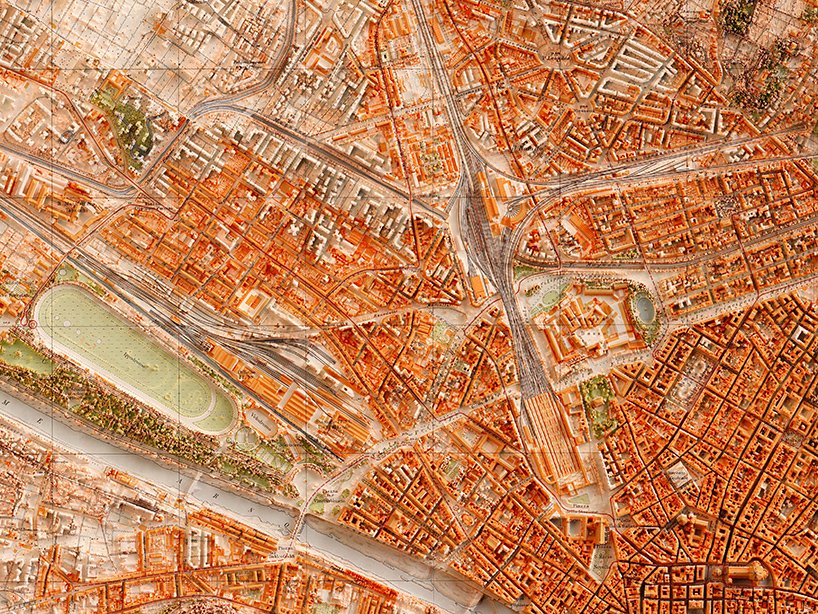
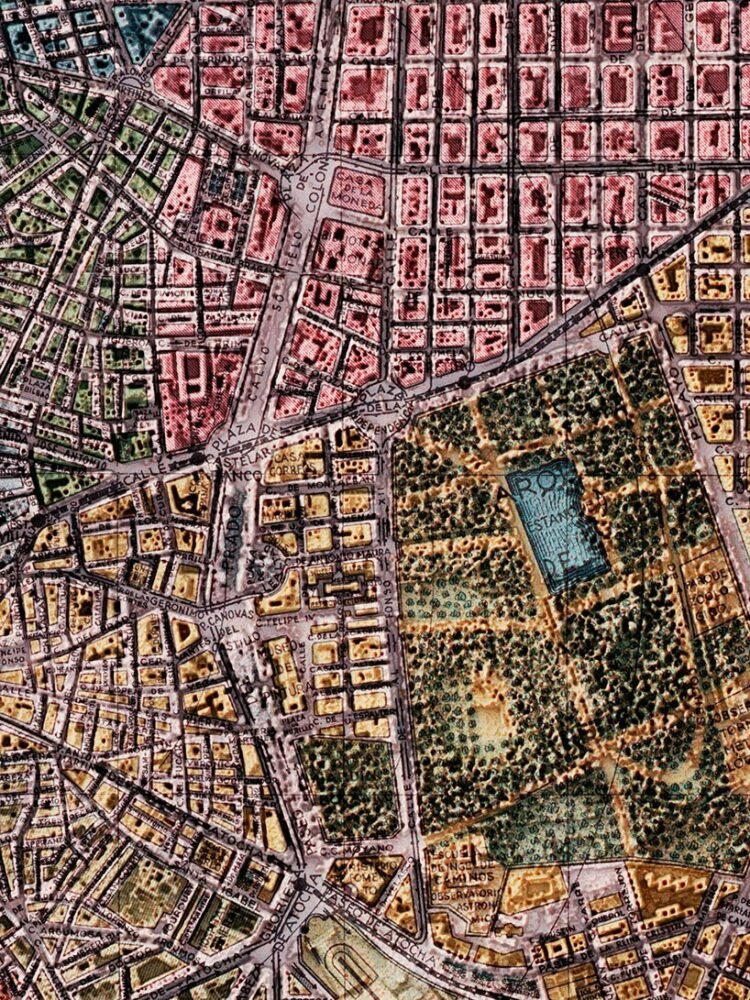
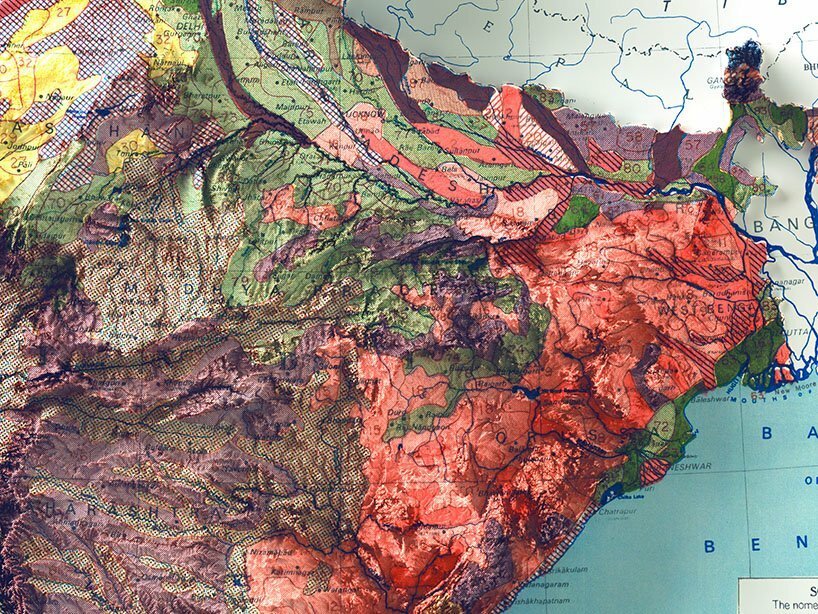
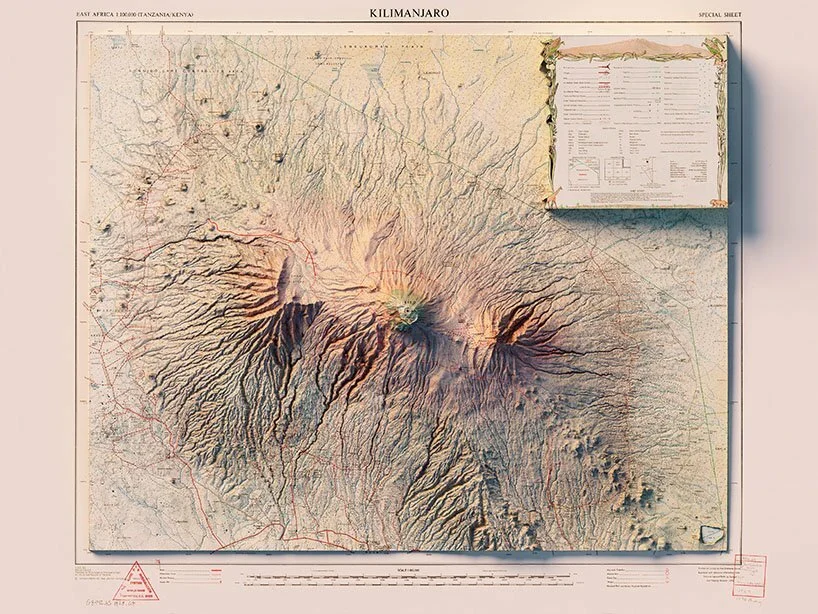
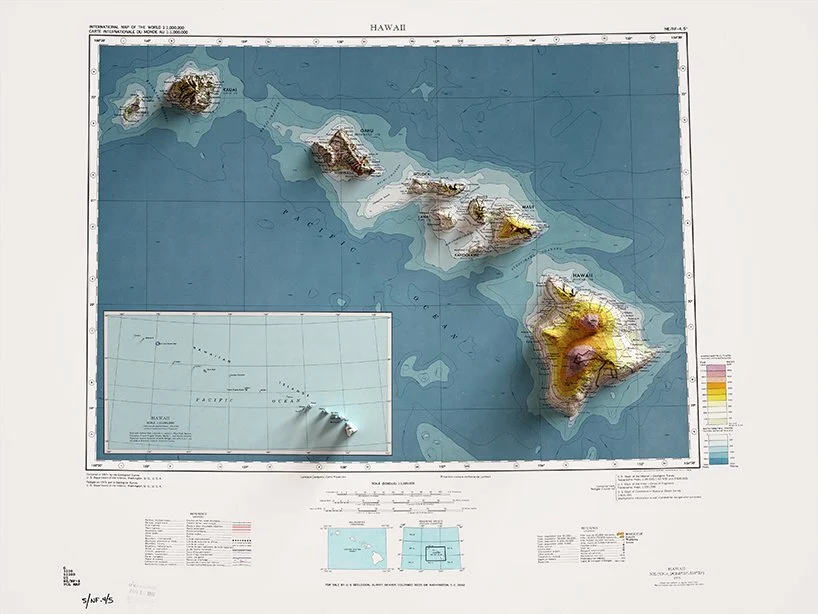
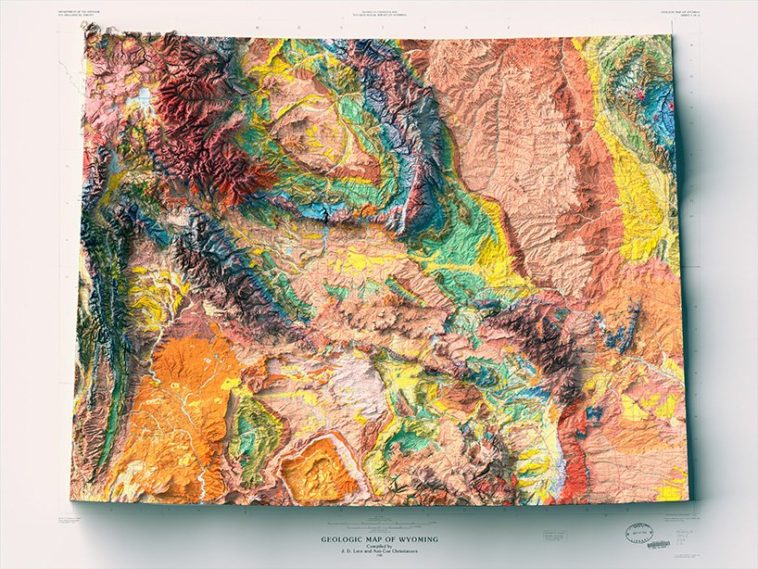
When Silvia Spacca and Leonardo Zanchi founded VizArt Studio in Orvieto, Italy, they had a simple goal: fusing data visualization with 3D cartography to create beautiful and informative maps and graphics. Both graduates of prestigious universities (Silvia in Film Engineering and Leonardo in Computer Science) brought different but complementary skills to the table and have worked together ever since to create stunning data visualizations that tell a story. From interactive visualizations to static infographics, geovisualization, to 3D shaded relief maps, VizArt is a studio that can do it all!
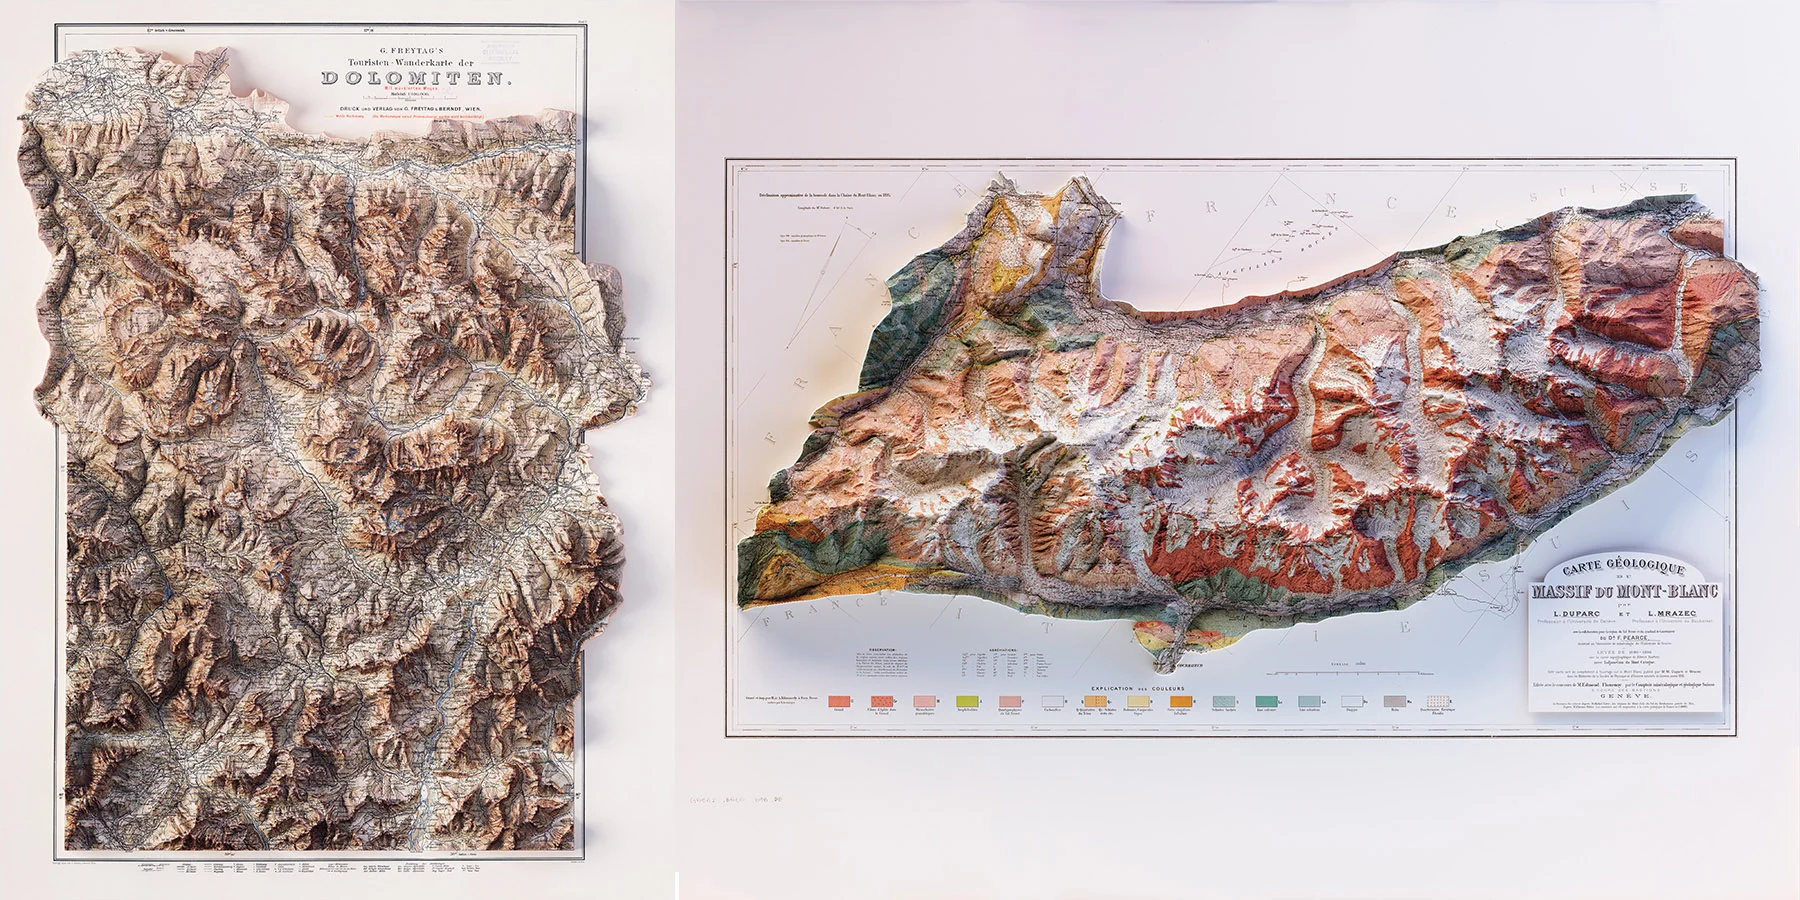
Distance places in time and space are brought to life and made tangible through conventional cartography and satellite data, culminating in a series of antique and modern 2D prints depicting shaded relief maps that may be purchased. VizArt has produced and updated topographical maps, hypsometric relief maps, and data visualization infographics for several customers. The mapmakers for VizArt were Peter Atwood, Morgan Hite, Joshua Stevens, and Daniel Huffman. VizArt’s cartographers and geo-referenda utilized their geographic knowledge and expertise to assist the organization with its initiatives.
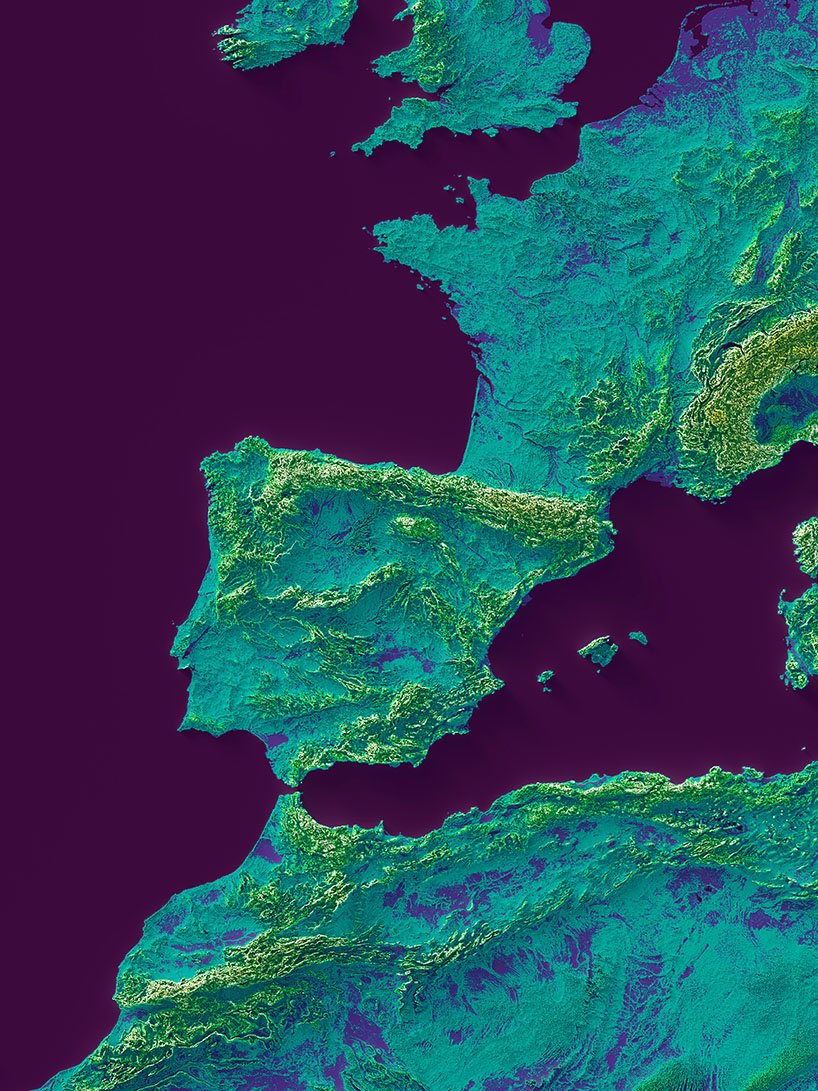
With the help of cartographers Daniel Huffman, Peter Atwood, Morgan Hite, and Joshua Stevens, who have offered their expert cartography and geo-referencing skills and knowledge, the Italy-based company’s work has been completed. The first stage of VizArt’s projects includes research, such as locating maps, obtaining licensing rights, and dating the project’s inception. When Silvia and Leonardo have identified a potential applicant, they thoroughly inspect the state of preservation and a digital restoration evaluation. Restoration work might include removing stains caused by deterioration or color correction, repairing damaged or missing components, or eliminating the sheet fold crease. Following that, the map is geo-referenced. The proper projection is sought to place it correctly in geographical location using the information supplied by the map, which generally includes only the year it was produced and the scientific organization that commissioned it. After that, digital elevation models are sought for and positioned. Depending on their kind, they may convey information on natural geographical features and broad surfaces like vegetation and structures.
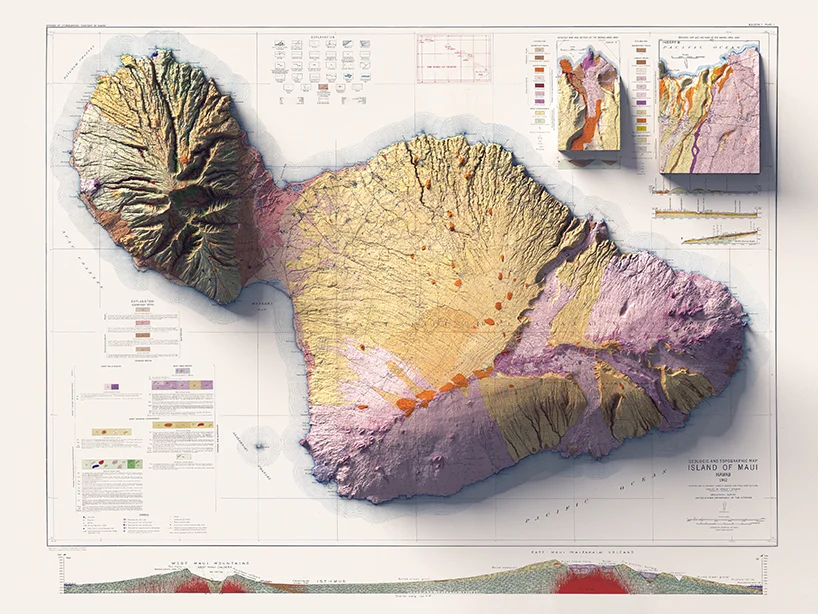
Silvia and Leonardo repeatedly combed the data and merged the resulting parts with three-dimensional modeling software. This determines the amount of light, the level of relief to be depicted, the depth of shadows, and the amount of space allocated to each element. Similar to a photograph, the temperature or intensity of light and the angle of a lamp’s shade contribute to each final picture’s quality and feel. ‘Because emotions and visuals are given greater weight than technical papers in the images we make, the reliefs have been exaggerated in some instances to emphasize the evocative qualities of a certain place,’ says VizArt. The addition of this feature aids the visibility of the elevation changes. For example, their series of Ipsometrical maps uses colors to indicate elevation, which has improved considerably.
